Cafe Rewards
☕ Project Synopsis
The Café Rewards Project is a full-stack data analytics case study that explores customer behavior and offer effectiveness for a coffee chain's rewards program. Using a combination of SQL, Python (Pandas), and Power BI, I performed end-to-end data wrangling, transformation, and analysis on over 300,000 customer event records.
Key objectives included:
-
Tracking offer engagement (viewed, completed) and linking it to transactions.
-
Analyzing demographic patterns in offer completion based on age, gender, and income groups.
-
Measuring offer performance across different channels (email, mobile, social, web).
-
Building a Power BI dashboard to visualize key KPIs and tell a compelling data story.
This project demonstrates my ability to clean and model data, create relational schemas, write complex SQL queries, and present insights through impactful data visualization.
Creating the Database
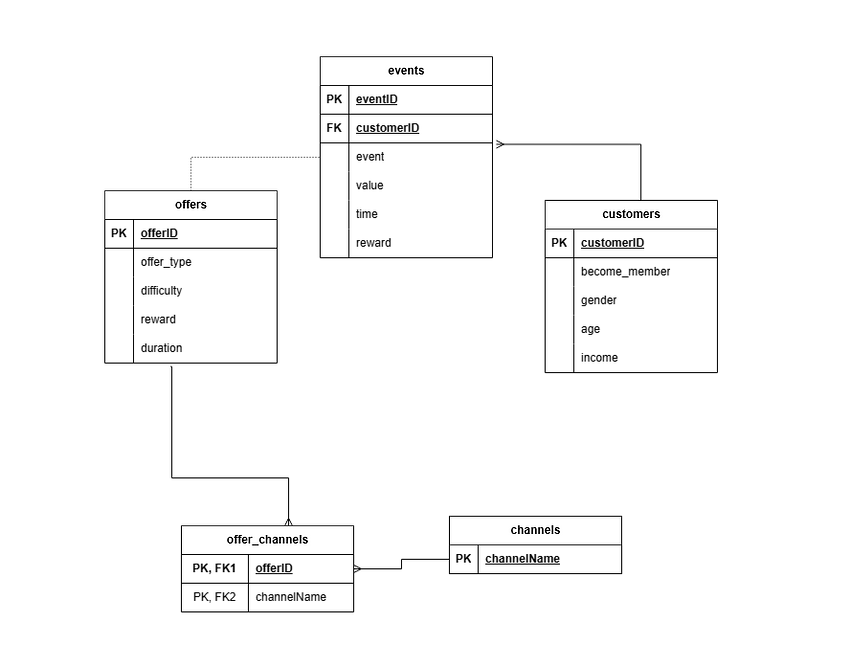
I designed a relational database schema to model and analyze customer interactions with promotional offers at a café chain. The goal was to track how different customer demographics respond to various types of offers, and ultimately measure the effectiveness of marketing strategies. The schema captures essential data such as customer information, offer details, delivery channels, and event logs (like receiving, viewing, or completing offers). Structuring the data this way made it easier to analyze key metrics like offer completion rates, average time to conversion, and behavioral patterns across age and income groups. This structured design not only ensured data integrity through primary and foreign key relationships, but also laid the foundation for building insightful queries, visualizations in Power BI, and driving business decisions with clean, reliable data.
To organize and manage my database structure effectively, I began by creating a custom schema. Using the CREATE SCHEMA statement allowed me to logically group related tables—such as customers, offers, events, and channels—under a single namespace. This not only improves clarity and maintainability but also enhances data governance and security, especially in larger or multi-user environments. Defining a dedicated schema for the project helped set the foundation for consistent naming conventions, easier access control, and smoother collaboration down the line. It’s a best practice that brings structure and scalability to any data project.
This part of the project focuses on transforming raw data into a structured, relational format by inserting cleaned records into their respective tables. The script ensures only valid and properly formatted data is loaded into the final schema. -Customers: Cleaned data from raw.customers is inserted into the customers table. Dates and numbers are cast safely using TRY_CAST, and gender values are trimmed to a single character for consistency. -Channels: The script extracts unique channel names from a raw JSON-like array using STRING_SPLIT and string cleaning functions, loading them into the channels table. -Offer Channels: A many-to-many relationship between offers and channels is established in the offer_channels table by linking each offer ID to its associated channels. -Customer Events: Finally, cleaned event data is inserted into customer_events from the staging table. It includes filtering logic to ensure only valid customer_id and offer_id values (those present in the customers and offers tables) are included, maintaining referential integrity. This entire process demonstrates how raw, messy data can be transformed and safely integrated into a normalized relational database for effective analysis.
Data Cleaning
I wrote a Python script to clean and structure semi-structured event data. The raw CSV file contained a value column with embedded dictionaries stored as strings—these included key information such as offer_id, reward, and amount. To transform this data into a usable format: -I used Python’s ast.literal_eval() to safely convert each stringified dictionary into an actual dictionary. -Leveraging pandas.json_normalize(), I expanded these nested dictionaries into flat, analyzable columns. -I handled inconsistencies in naming, such as converting 'offer id' to the standardized offer_id. -Finally, I merged the cleaned data with the rest of the dataset and exported it as a clean CSV file ready for SQL staging and analysis. This process ensured data quality, consistency, and readability—critical steps for reliable reporting and analytics.
To maintain the integrity and accuracy of the database, I implemented a cleaning process in SQL targeting incomplete and invalid records: Step 1: I removed staging records from customer_events_staging where the customer_id didn’t match any ID in the customers table—this helped prevent orphaned event records from entering the main dataset. Step 2: I identified users with suspiciously high ages (over 110), which were likely placeholder or default values (e.g., age 118). Using a temporary table, I staged these invalid customer_ids for deletion. Step 3: I deleted all associated records from the customer_events table before removing the customer records themselves, preserving referential integrity and preventing foreign key conflicts. Step 4: The entire operation was wrapped in a transaction block to ensure that either all deletions happened together or none at all—this protected against partial or inconsistent data updates. This approach ensured that only valid and meaningful customer data remained, enhancing the quality of downstream analysis.
Querying And Deriving Insights
What This Tells You
-
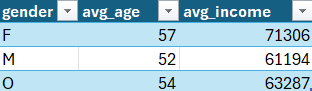
Women in the dataset have the highest average income and are also the oldest group on average.
-
Men have the lowest average income and are younger on average than females.
-
Customers identifying as Other (O) fall in between both groups in terms of both age and income.
Possible Interpretation
-
Higher average income in older women may suggest more purchasing power or higher brand loyalty in this segment.
-
Understanding these differences can help in targeting promotional offers — for example, tailoring higher-value rewards or personalized messaging toward the female demographic.
-
Segmenting your offers or channels by gender and income could lead to improved completion and engagement rates.
What This Tells You
-
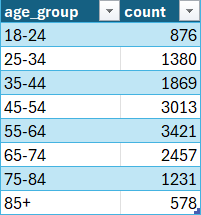
The largest customer segments are between the ages of 45–64, accounting for over 6,400 customers combined.
-
Engagement tends to drop in the youngest (18–24) and oldest (85+) groups, which may reflect less interest in or access to the rewards program among those demographics.
-
The middle-aged demographic (45–64) is the sweet spot, likely reflecting a blend of disposable income, familiarity with loyalty programs, and frequent purchases.
Possible Interpretation
-
This insight can guide targeted marketing strategies:
-
Focus more effort on middle-aged customers through personalized offers or high-reward incentives.
-
Consider tailored communication or simpler UX for the older demographic (75+) to boost engagement.
-
Re-evaluate the approach or incentives for younger users, possibly using mobile-first channels or gamified experiences.
-

What This Tells You
-
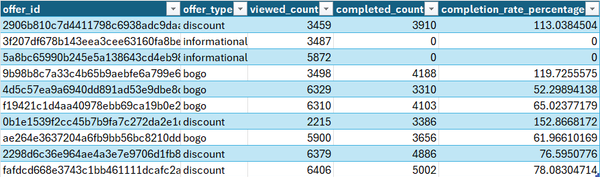
Discount and BOGO offers dominate view counts, particularly with IDs like fafdcd..., 2298d6..., and 4d5c57... all receiving over 6,000 views each.
-
Informational offers also perform well, with one reaching nearly 5,900 views, suggesting that even non-redeemable content can capture attention.
-
The least viewed offers were one discount (2,215 views) and one informational (3,487 views), indicating variability even within the same offer type.
Possible Interpretation
-
Customers are most likely to engage with offers that provide clear, direct rewards like discounts or BOGOs.
-
The high visibility of some informational offers suggests that education or branding-focused content still has value—especially when well-targeted.
-
Consider A/B testing future offers of the same type to understand which specific attributes (timing, channel, design) drive higher engagement.
What This Tells You
-
Completion rates exceeding 100% (e.g., 152.87%, 119.73%) indicate data anomalies — some offers have more completions logged than views, which could be due to delayed or missing event data or multiple completions per view.
-
Informational offers have zero completions, which is expected since these offers don’t require completion.
-
Among offers with reasonable data, completion rates vary widely:
-
Some BOGO offers have moderate completion rates (~52-65%).
-
Some discount offers show higher completion rates (up to ~78%).
-
-
The variability suggests that offer type alone doesn’t guarantee success; other factors like offer appeal, timing, or targeting may influence completion.
Possible Insights
-
Investigate why completion counts exceed views — this could highlight issues in event tracking or customer behavior anomalies.
-
Consider focusing on offers with higher completion rates to optimize marketing efforts.
-
Informational offers serve a different role—focus on metrics like reach or subsequent transactions rather than completions.
What This Tells You
-
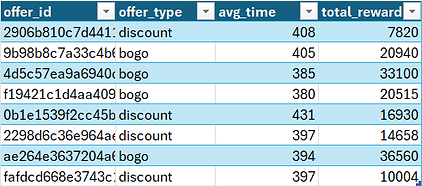
Average completion times are fairly consistent across offer types, ranging roughly from 380 to 431 hours (about 15-18 days).
-
BOGO offers tend to generate higher total rewards compared to discounts, suggesting these may encourage more spending or higher-value redemptions.
-
The variation in total rewards among BOGO offers is quite large, with some offers generating over 33,000 while others near 20,000, indicating differing effectiveness or scale.
-
Discount offers generally yield lower total rewards but maintain steady average completion times.
Possible Insights
-
Customers seem to spend a similar amount of time completing different types of offers, so time investment might not vary much by offer type.
-
BOGO offers could be more lucrative overall, making them a strong candidate for marketing focus if maximizing reward payout aligns with business goals.
-
Further analysis could explore what drives the differences in total reward amounts among similar offer types—such as customer segments, offer difficulty, or reward size.
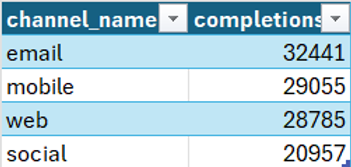
channel_namecompletions email32441 mobile29055 web28785 social20957
What This Tells You
-
Email is the most effective channel, driving the highest number of offer completions (32.4K), suggesting it may have better visibility or engagement among customers.
-
Mobile and Web channels follow closely, each contributing nearly 29K completions, showing strong performance likely due to their convenience and accessibility.
-
Social media, while the lowest performing, still contributes significantly, indicating it's a useful supplementary channel but potentially less direct in converting customers.
Possible Insights
-
Email campaigns could be prioritized for future promotions, given their high completion rates.
-
A combined strategy across Email, Mobile, and Web might maximize reach while reinforcing the message through multiple touchpoints.
-
Social channels may require optimized content or targeting strategies to improve conversion effectiveness.
-
Further segmentation could reveal if certain demographics respond more to one channel than another, allowing for tailored multi-channel marketing.
Completed Offers by Gender, Age Group, and Income Bracket
-
Shows how completed offers are distributed across demographic groups.
-
Helps identify which age, gender, and income segments are most responsive to offers.
-
Useful for demographic-based targeting and campaign personalization.
Informational Offers That Resulted in a Transaction
-
Counts customers who received an informational offer and later made a transaction.
-
Indicates whether informational offers influence purchasing behavior.
-
Useful for evaluating the indirect impact of non-reward offers.
Customers with More Offer Completions Than Views
-
Finds cases where completions exceed views for the same customer and offer.
-
May reveal tracking or data logging inconsistencies.
-
Helps identify possible anomalies or behaviors not captured by "viewed" event
Average Completion Time, Count, and Reward by Age Group and Offer Type
-
Calculates average time to complete offers and total rewards by age group and offer type.
-
Highlights which age groups complete offers faster and contribute more value.
-
Useful for pacing offer durations and tailoring offer types to age segments.